| |
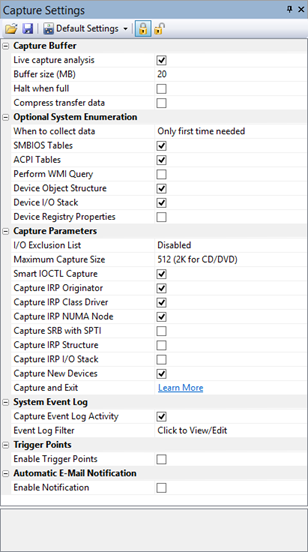
The Capture Settings pane shows you your capture settings. Click on an area in the picture to learn more about that specific section:
Toolbar Options
Load/Save Capture Settings
|
You can save your capture settings to file or load any previously saved capture settings from file. |
| Default Settings |
You can click on the Default Settings button to reset our capture settings back to factory defaults. If you don't like our default settings, you can click on the drop list menu item to change the default settings. |
| Linked Settings |
Selecting the Linked Settings button causes any device capture setting you change to be applied to all devices. This is the default configuration. |
| Unlinked Settings |
If you want capture settings unique per device, you would select the Unlinked Settings button. |
| Link Sibling Nodes Only |
Starting with busTRACE 10.0.033, a new toolbar button appears just to the right of the "Unlinked Settings" button. When this option is configured, any capture settings you change will apply to the currently selected node as well as all of its siblings. This makes it easier for you to, for example, adjust the capture settings for all devices connected to a single HBA without altering your other settings. |
Capture Buffer
This section allows you to adjust your capture buffer settings.
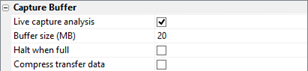
Live capture analysis |
busTRACE can capture and analyze I/O activity in one of two ways. One is with "Live" capture analysis enabled; the other is with it disabled.
When busTRACE capture is active, and live capture analysis is enabled, you can view I/Os being captured as they occur. You can scroll around and view any I/Os of interest. Any I/Os that are captured are simply appended to the I/O Capture List automatically.
When busTRACE capture is active, and live capture analysis is disabled, you are not allowed to view I/O activity until after you stop the capture process. Once the capture process is stopped, all of the I/O activity captured up to that point will then appear.
Typically you will leave this feature enabled. However, there are times where you might want to disable the feature:
- Disabling this feature gives you the lowest busTRACE CPU overhead. If you are concerned about any impact capturing I/O activity will have on a performance test you're running, simply disable this feature. When disabled, busTRACE simply captures the I/O results down in kernel mode and then lets the I/O continue on its way.
- If live capture analysis is enabled, the system could theoretically generate I/O faster than busTRACE can process it. For example, fast hard drives being sent a large quantity of I/O activity at a given time. In such a case, busTRACE may automatically stop the capture process and notify you that the system is generating I/O faster than it can process it. In this case, you can simply disable live capture analysis and the problem will not occur again.
|
| Buffer size (MB) |
When you click on this field, you are shown a slider where you can adjust the busTRACE capture buffer size. The larger the buffer, the more I/O activity you will be able to capture. The amount of memory busTRACE will allow you to allocate depends on how much memory you have in your computer. |
| Halt when full |
busTRACE uses a circular buffer. That is, when the capture buffer gets full, older I/Os are removed from memory to make room for newer I/O activity. By placing a checkmark next to this option, you are informing busTRACE that you want it to automatically stop the capture process when the buffer is full.
|
| Compress transfer data |
You can configure busTRACE to compress the captured data in memory. Depending on the type of data being captured, this will usually require less memory stored per each I/O. This, in turn, allows you to capture even more I/O activity into memory. This feature is only available when live capture analysis is enabled.
|
| Network compression |
This option will only appear if you are performing a remote capture. Having this option enabled will cause busTRACE to compress the capture data before sending it across your network.
|
Optional System Enumeration
These settings allow you to configure optional system/device information that busTRACE can enumerate and make visible to you in the System Explorer.
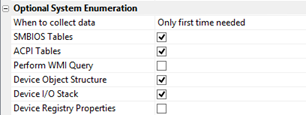
When to collect data |
Here, you specify when you want busTRACE to perform the additional enumerations.
|
| SMBIOS Tables |
Selecting this option causes busTRACE to enumerate and cache the system's System Management BIOS (SMBIOS) data structures. The SMBIOS specification defines data structures stored in the BIOS of the computer. |
| ACPI Tables |
Selecting this option causes busTRACE to enumerate and cache the system's Advanced Configuration and Power Interface (ACPI) data structures. ACPI provides an open standard for device configuration and power management by the operating system. You will need to leave this setting enabled if you want to capture NUMA node information. |
| Perform WMI Query |
busTRACE can optionally perform a Windows Management Instrumentation (WMI) query and save the results with the busTRACE capture file. WMI is fully detailed on Microsoft's WEB site. Simply perform a WEB search for "Microsoft WMI".
|
| Configure WMI Query |
You can select the WMI query to perform by selecting this option. A dialog box is brought up where you can create your WMI query and see the results of the query on the target system. This option only appears after placing a checkmark on the "Perform WMI Query" option.
|
| Device Object Structure |
Selecting this option causes busTRACE to enumerate and cache each device's kernel DEVICE_OBJECT structure.
|
| Device I/O Stack |
Selecting this option causes busTRACE to enumerate and cache each device's I/O stack entries.
|
| Device Registry Properties |
Selecting this option causes busTRACE to enumerate and cache each device's registry properties.
|
Capture Parameters
Capture Parameters are used to tell busTRACE what parts of the I/O should be captured for analysis.
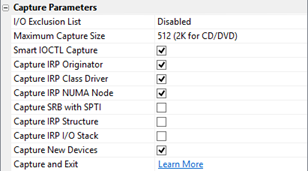
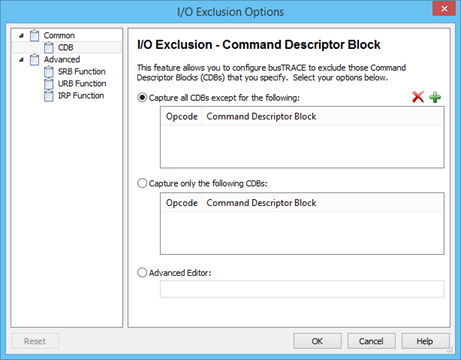
| I/O Exclusion List |
You can select this option to exclude certain I/Os from being captured. You can excluded I/Os based on their CDB, SRB Function, URB Function, or IRP Function.
|
Maximum Capture Size |
Each I/O that is occurring within your system might transfer a large amount of data. For example, let's say an I/O is sent to read 128 blocks from the hard drive. Blocks typically store 512 bytes. That would mean that the system is attempting to read 512*128 bytes which is 64K. busTRACE can capture the entire data, if so configured.
You may find that you are not interested in storing the entire amount of data transferred with each I/O. Perhaps you are only interested in the first 16 bytes or no data at all. Perhaps you're only looking for error information and do not care about the data.
Simply enter the maximum number of bytes you would like captured per I/O. The smaller the value, the more I/O activity busTRACE will be able to capture into memory (as less space would be used to store any data transferred). busTRACE defaults to storing up to the first 512 bytes of transfer in the capture buffer (2048 for CD/DVD/BD devices).
You can enter the data in hex format if you like. Simply append the data with 'h'. For example, to submit 256 decimal bytes as the value, in hex, you would enter 100h. |
| Smart IOCTL Capture |
When an IOCTL is submitted to a device object, some of the inbound and/or outbound data is irrelevant. Capturing that data provides no value to the user. By selecting this option, on specific IOCTLs, if busTRACE detects this condition, it will only capture the pertinent data.
|
| Capture IRP Originator |
Select this option if you want busTRACE to enumerate the driver (kernel IRP) or process (user mode IRP) that generated the I/O.
|
| Capture IRP Class Driver |
Select this option if you want busTRACE to enumerate the class driver for this I/O.
|
Capture IRP MDL |
Select this option if you want busTRACE to capture the IRP's Memory Descriptor List (MDL). You should leave this option enabled if you need to perform Data Corruption Analysis. |
Capture IRP NUMA Node
|
Select this option if you want busTRACE to enumerate the NUMA Node the I/O is running on (e.g. IRP's data buffer and processing CPU).
|
| Capture SRB with SPTI |
This feature can only work if you have our Advanced Filtering feature enabled.
Windows storage port drivers (e.g. STORPORT.SYS, ATAPI.SYS, USBSTOR.SYS, etc.) can be sent two types of requests. One is a SCSI Request Block (SRB). SRBs allow another device driver to send down a request to a device. The other is a SCSI Pass Through IOCTL (SPTI). SCSI Pass Through IOCTLs are accessible to ring 3 applications that want to send down a CDB to a storage device. busPROBE, for example, uses SCSI Pass Through IOCTLs to send CDBs.
When a port driver receives a SCSI Pass Through IRP, many will internally create an SRB IRP and send it to the device. The contents of the SRB IRP are usually identical to the SCSI Pass Through IRP. It is for this reason that busTRACE defaults to only showing you the SCSI Pass Through IRP.
If you place a checkmark on this option, busTRACE will attempt to capture any SRB IRPs that are being created in order to process the SCSI Pass Through IRP. Our ability to do this is dependent on the port driver.
|
| Capture IRP Structure |
Select this option if you want busTRACE to capture the IRP structure.
|
| Capture IRP I/O Stack |
Select this option if you want busTRACE to capture the entire I/O stack contents (for all drivers in the stack). The stack contents are copied copied both going down and back up the I/O stack. This can be useful if you want to see which drivers insert themselves into the I/O stack for the given IRP.
|
| Capture New Devices |
When busTRACE is active capturing I/O activity, this setting lets busTRACE know what it should do when new devices appear while the capture is active. Placing a checkmark on this option will cause busTRACE to automatically capture I/O activity on the new devices. Removing the checkmark will tell busTRACE to ignore any new devices added while the capture is active.
|
| Capture and Exit |
When busTRACE is busy capturing I/O activity, you normally cannot exit busTRACE with the capture active. However, if you have live capture analysis disabled, and you try and exit busTRACE, you will see a Capture and Exit option:
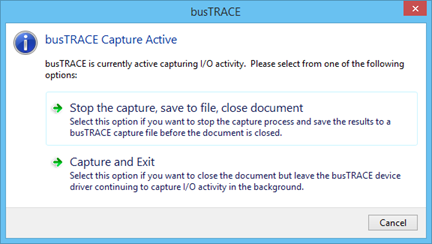
By selecting the Capture and Exit option, the busTRACE application will close but leave the kernel driver active capturing I/O activity. In this configuration, there is no application running. Only the kernel driver is active. When you re-run busTRACE, the capture process will continue and you can stop and save the capture results.
NOTE: Event Log activity is only captured while the busTRACE capture application is running. While in Capture and Exit mode, event log activity will not be captured. |
Event Logs
You can configure busTRACE to capture event log activity. This can be useful if you want to see any events generated by various device drivers in the I/O stack. Events are not detected in real time as the OS does not store them in real time. Event log entries are usually recorded within less than a second of the event occurring.

Trigger Points
A trigger point is a specified condition that will cause busTRACE to automatically stop the busTRACE capture when the condition is hit.
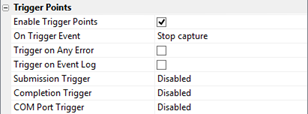
| Enable Trigger Points |
To enable trigger points, you start by placing a checkmark on this option. Once you do so, the remaining trigger point options will appear.
|
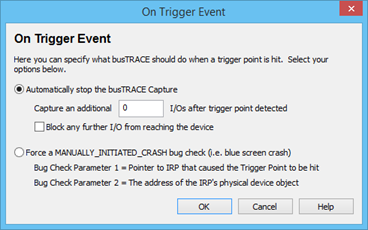
| On Trigger Event |
You can configure busTRACE as to what it should to do when a trigger point occurs. You can have it automatically stop the capture and optionally block further I/O from reaching the device. If you want to try and keep the system in its current state, you can also force a bug check.
|
| Trigger on any error |
Place a checkmark on this option if you want any failed I/O to set a trigger point.
|
| Trigger on Event Log |
Place a checkmark on this option if you want an event log entry to set a trigger point. |
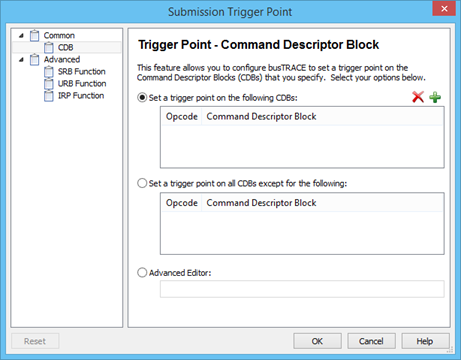
| Submission Trigger |
Here you can specify an I/O submission that would cause a trigger point. You can configure the trigger point based on its CDB, SRB Function, URB Function, or IRP Function.
|
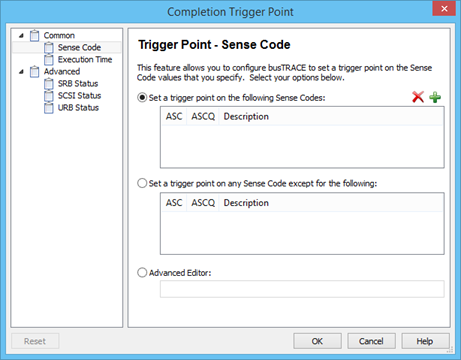
| Completion Trigger |
Here you can specify an I/O completion that would cause a trigger point. You can configure the trigger point based on its sense code, execution time, SRB Status, SCSI Status, or URB Status.
|
| COM Port Trigger |
Here you can specify an input or output trigger point on a given COM port. If using an output trigger, any time busTRACE detects a trigger point, it will set the RTS line on the specified RS-232 port. If an input trigger is configured, if the CTS line on the specified RS-232 COM port is set, a busTRACE trigger point will be set.
It the setting is disabled within busTRACE, this indicates that no serial ports were detected on the system. |
Automatic E-Mail Notification
Here you can configure busTRACE to automatically e-mail you when a specified event occurs. This can be useful when you are running a stress test and you want busTRACE to immediately notify you when an event occurs. You could send your wireless phone a text e-mail message, for example.
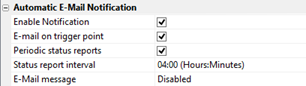
| Enable Notification |
To enable the automatic e-mail notification feature, you start by placing a checkmark on this option. Once you do so, the remaining options will appear.
|
| E-mail on trigger point |
Place a checkmark on this option if you want an e-mail sent out any time a trigger point is detected.
|
| Periodic status reports |
Place a checkmark on this option if you want busTRACE to e-mail you periodic status reports.
|
| Status report interval |
If you enabled Periodic status reports, specify the frequency of the status reports here.
|
| E-Mail message |
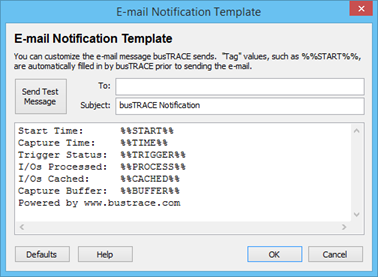
Here you specify the e-mail message to send out, who to send it too, its message subject, and its message body.
|
Selecting the Expand button in the E-Mail message section allows you to modify the e-mail that is sent out:
Before busTRACE can successfully send out auto e-mail notifications, you need to make sure your e-mail client is properly configured. E-mail packages that require user approval before we can send e-mail through it, such as Microsoft Outlook, are not supported. The reason for this is that the e-mail client would be waiting for you to approve the sending of the e-mail. This obviously would not work as you want busTRACE to e-mail you without user interaction required.
The following steps assume you are using Outlook Express 6.
- Run Outlook Express 6 and configure it with an e-mail account by selecting Accounts from the Tools main menu (within Outlook Express itself). busTRACE will use your default email account to send e-mail. Once your e-mail account is configured, and you have verified that it is working properly, proceed to the next step.
- Select Options from the Tools main menu. Click on the General tab that appears and, if the button is enabled, click on the Make Default button where it says "This application is NOT the default Mail handler."
- Within the Options window, click on the Security tab and remove any checkmark next to the "Warn me when other applications try to send mail as me."
- Click on the OK button to exit.
At this point, Outlook Express 6 has been configured such that busTRACE can use it to send e-mail. We recommend you send out a test message, through busTRACE, to ensure everything is working properly.
|
|