|
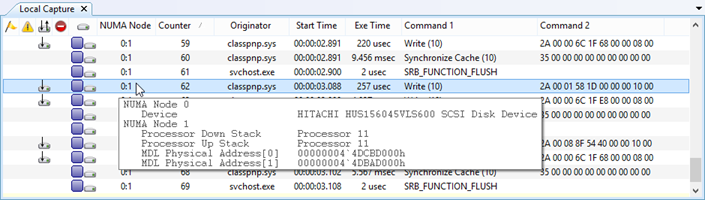
If your system has multiple NUMA Nodes, you can configure busTRACE to capture NUMA Node information. Run our NUMA Node Performance Tester to understand why non-NUMA node optimized I/O activity can impact performance. If you configure busTRACE to view NUMA Node information in the I/O Capture List, busTRACE will show you the NUMA Node the I/O was associated with. In many cases, you will only see a single value here. For example, if you see a value of 0 in the column entry, this just means that the entire I/O was executed on NUMA Node 0. However, in other cases, you may see multiple values such as in this example:
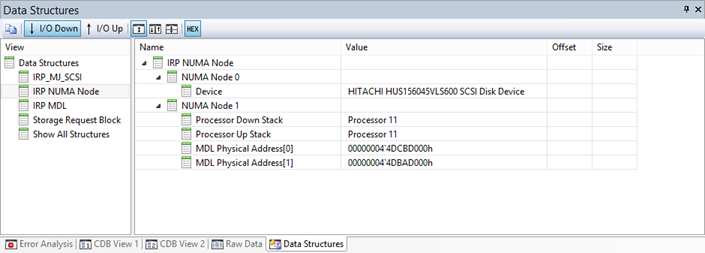
In reviewing the screenshot above, busTRACE is telling us that the I/O was submitted and completed on NUMA Node 1, the data buffer was located on NUMA Node 1, but the device itself was located on NUMA Node 0. This is a non-optimized I/O since additional latency is incurred when data is transferred from the memory on NUMA Node 1 to the device on NUMA Node 0. Iin most cases this additional latency is negligible. However, when you start using high performance storage devices (i.e. PCIe SSDs, RAM drives, etc.), the additional latency can have an impact. When you select an I/O, and click on the Data Structures tab, you can see similar NUMA Node information:
Clicking on the "IRP MDL" option will show you the entire Memory Descriptor List (MDL) structure. In order for busTRACE 10.0 to be able to report you which NUMA Node the memory was located in, your system must support the System Resource Affinity Table (SRAT) ACPI table. You must leave the ACPI enumeration option enabled.
|
|